KEY FIGURES
€35 million in investment
3,800 sq. m
Grenoble
| The platform is at the international state of the art, with advanced characterization equipment like the
TiTAN Themis, a 50-picometer-resolution transmission electron microscope that also provides local chemical information. The platform also has an
XPS/HAXPES instrument that uses high-energy X-rays (Cr-Kα source) and a conventional Al-Kα source to analyze the chemical and electronic structure of buried surfaces, films, and interfaces. And with a
3D FIB SEM (potentially cryo), the platform can perform
tomographic analyses down to a few nanometers.
CEA-Liten's characterization activities are backed by in-depth knowledge of materials used in electrochemical systems like batteries, fuel cells, and high-temperature electrolyzers, as well as in metal alloys, photovoltaic cells, catalysts, and polymers.
|
The platform also works closely with Grenoble's large European instruments (the ESRF synchrotron and the ILL neutron beamline) for access to additional characterization equipment to round out the analyses completed on the platform's own equipment.
| 
|
|
|
Advanced characterization methods shed light on neodymium-iron-boron permanent magnet microstructures
Micrometer-scale characterization provides initial information on homogeneity, grain size, and the nature and location of chemical phases.
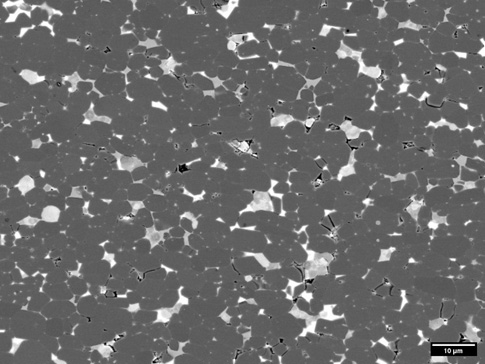
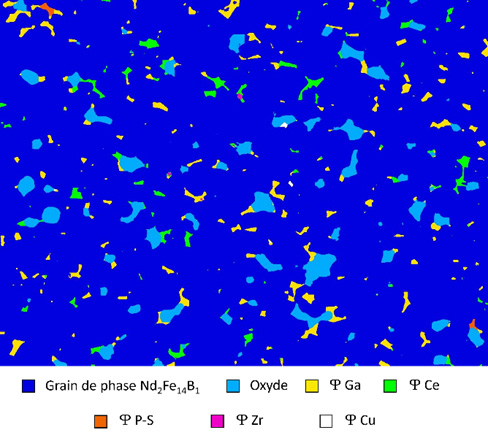
At CEA-Liten, we conduct traditional SEM analyses. We are also working on image processing techniques to separate and measure the different phases present in magnet microstructures. The only way to accurately segment all the phases in the images, for example, is to combine backscattered electron, or BSE, imaging (Fig. 1), which provides chemical contrast, with energy-dispersive X-ray spectroscopy mapping, which delivers additional chemical information. We do this using machine learning with a software application called ILASTIK. The software can accurately identify the different phases in an image, including phases at grain boundaries and phases with very similar contrasts, making them difficult to distinguish. The information can then be applied to images of other samples of the same type (Fig. 2) [1].
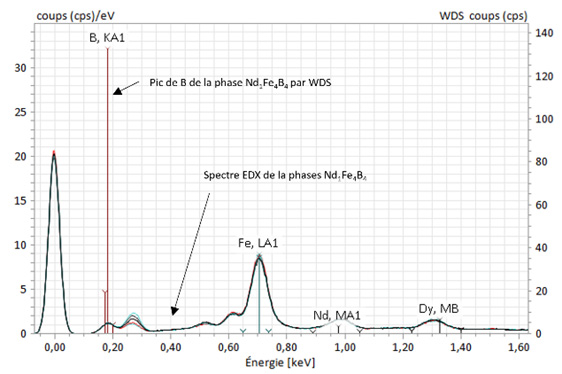
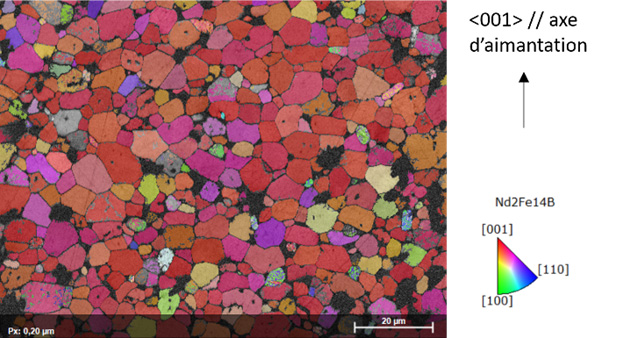
If additional measurement data is needed, we can also use WDS [2] (wavelength-dispersive X-ray spectroscopy) to conduct a deeper analysis (Fig. 3). With WDS, elements like boron, which cannot be measured in small amounts using EDX, can be measured. This kind of information can be crucial to a detailed analysis of the different phases and of magnet performance. Finally, EBSD [3] (electron backscattered diffraction) is a technique (Fig. 4) used to map crystallographic grain orientation, which has a significant impact on magnet remanence.
| 
|
Figure 1: image MEB – BSE (Back scattered electrons) d’un aimant fritté comprenant la phase majoritaire Nd2Fe14B1 (grises foncées) et d’autres phases aux joints de grains (grises claires ou blanches)
|
Figure 2: Image segmentée de toutes les phases, obtenue en combinant par machine learning les informations de l’’image en contraste d’électrons rétrodiffusés avec la cartographie EDX
|
| 
|
Figure 3 : spectres EDX de la phase Nd1Fe4B4 et pic de B obtenu par WDS permettant d’estimer la teneur de cet élément dans la phase analysée.
|
Figure 4. Cartographie d’orientation des grains qui montre un alignement de l’axe <001> de la structure cristalline de la phase Nd2Fe14B1 avec l’axe d’aimantation.
|
Nanometer-scale characterization for detailed phase analysis at grain boundaries
TEM can be used for local, detailed observation of the thin phases at grain boundaries, where a large portion of magnets’ magnetic properties are determined. This type of characterization entails selecting the very specific areas to be observed by using a FIB [4] (focused ion beam) to cut slices measuring a few micrometers in length and around 100 nanometers thick. (Fig. 5). Sample oxidation and the potential alteration of the phases being observed are limited by using special systems to transfer samples between equipment (FIB, TEM) under an argon atmosphere or under vacuum. The image in Figure 6.a, obtained using HR-STEM (high-resolution scanning transmission electron microscopy), combined with the EDX analysis shown in Figures 6.b and 6.c, shows the presence of Nd and Cu in a phase a few nanometers thick along the grain boundaries: This phase’s presence along the entire grain boundary is crucial to effective grain decoupling, reducing coercivity.
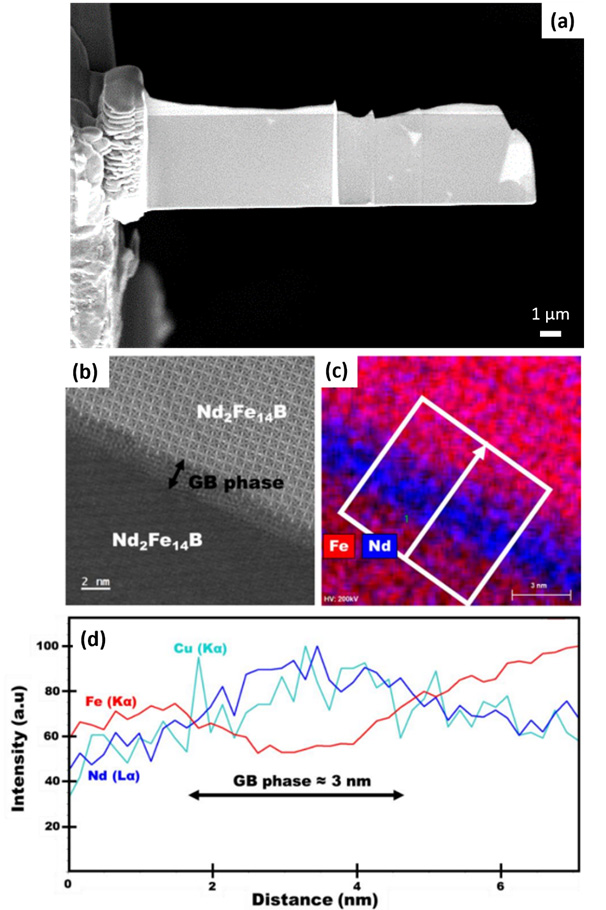
Figure 5: HR-STEM-HAADF image (b) of a FIB sample (a) taken from a sintered magnet; mapping (c) and EDX profile (d) of a thin phase rich in Cu and Nd at the grain boundaries (Abir Ismail, PhD dissertation, 2023).
Conclusion
By combining different structural and chemical analyses at different scales, different ways of looking at the material can be compared, an approach that provides a deep understanding of a magnetic material’s microstructures. When used with modeling tools, this approach to advanced characterization can help inform decisions during the development of materials and processes. At CEA-Liten, our materials and characterization experts are working together to use precisely this approach.
[1] Zeiss Merlin and Ultra 55 SEM
[2] Bruker XSENSE WDS detector
[3] Bruker e-flash HR EBSD detector
[4] Zeiss CB750 FIB, Gatan vacuum transfer holder, SEM transfer case ↔ Zeiss FIB