Sylvain Lespinats, a CEA research engineer at INES who recently received his “Habilitation à Diriger des Recherches", is a specialist in data mining methods:
"As soon as I entered the world of research in 2002, I was hypnotized by everything that could be seen from data. Careful observation sometimes reveals unexpected phenomena. In my opinion, it's a critical step for making good progress afterwards."
He is interested in data mining methods, and in particular in non-linear "projection" methods.
Data mining methods rely on a set of data placed in a metric space, where the distances between them can be calculated. Data are often points in a multi-dimensional space with a classical (Euclidean) distance, but not exclusively: for example, current-voltage curves of photovoltaic systems are parametric curves and meet this definition. Non-linear projection methods use the set of distances between the data to produce a low-dimensional synthetic representation of the data, so that important structures in the dataset can be visualized. These representations take the form of point clouds, "maps" presenting the "geography" of the data.
Without going into detail about the various models and methods, here are just three illustrations of what one can achieve to better see and understand the phenomena or behavior of complex systems.
|
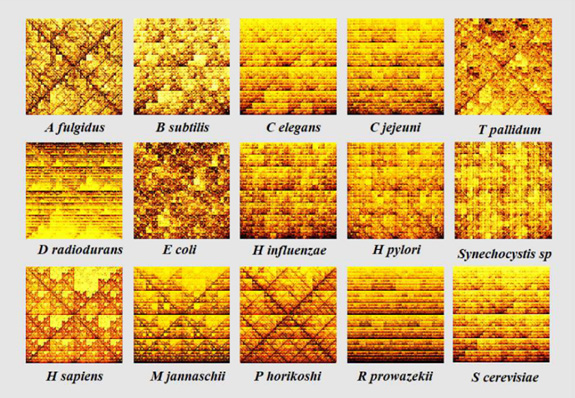
Applied to the study of the genome, the entire genetic material of an individual or species, encoded in its DNA, this illustration is an example. You can see a representation of the differences and similarities of the genomic signatures of 15 species using an algorithm called CGR, an acronym for "Chaos Game Representation".
|
Applied to the building sector and to the failures of a heating system, projection methods offer an intuitive way of seeing the similarities and differences between situations encountered and those encountered in the past. It then becomes easy to use a map to interpret and react to the current situation.
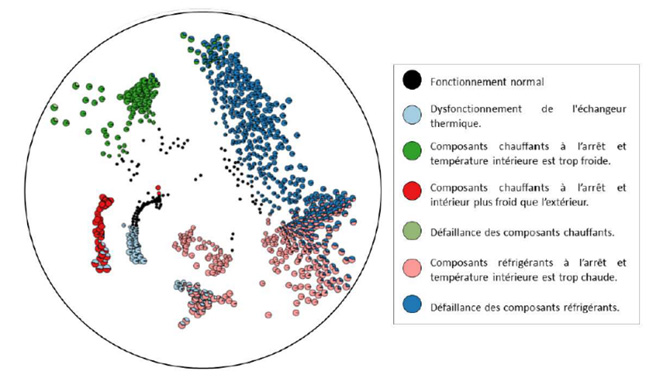
| Here, the map is obtained using the ASKI method, based on heterogeneous data such as temperatures and electricity consumption. Each circle is a pie chart representing a moment in the life of the building in terms of the proportion of defects observed and their severity.
|
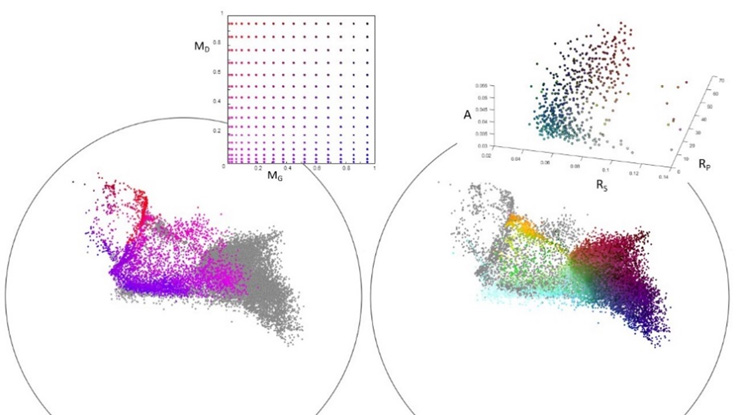
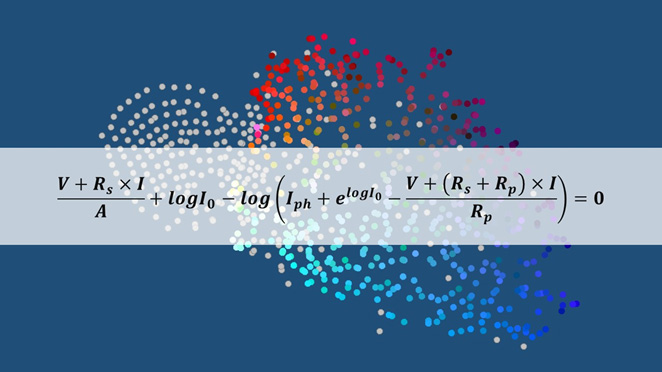
Applied to photovoltaics systems: current-voltage curves provide information on the correct operation of photovoltaic systems. The conventional method for producing a diagnosis from these data involves modeling, based on the computationally-intensive single-diode model. Non-linear projections offer an almost instantaneous alternative, and show a data organization consistent with the main features of the one-diode model used for diagnosis.
|
We use them to refine photovoltaic production forecasting algorithms, to explore the composition and pollution of photovoltaic cell surfaces, to understand the behavior of batteries as a function of the acoustic signals they emit, and to develop tools for diagnosing faults in photovoltaic power plants, to name but a few.
An excellent resource for quickly and effectively understanding the issues at stake, and for supporting researchers who gain a new and intuitive vision of their objects of study.
Article based on Sylvain Lespinats' HDR manuscript
Credit CEA